- Indico style
- Indico style - inline minutes
- Indico style - numbered
- Indico style - numbered + minutes
- Indico Weeks View
ENBIS Webinar: Classmaps for Visualizing Classification Results
→
Europe/Amsterdam
,
Description

Classmaps for Visualizing Classification Results
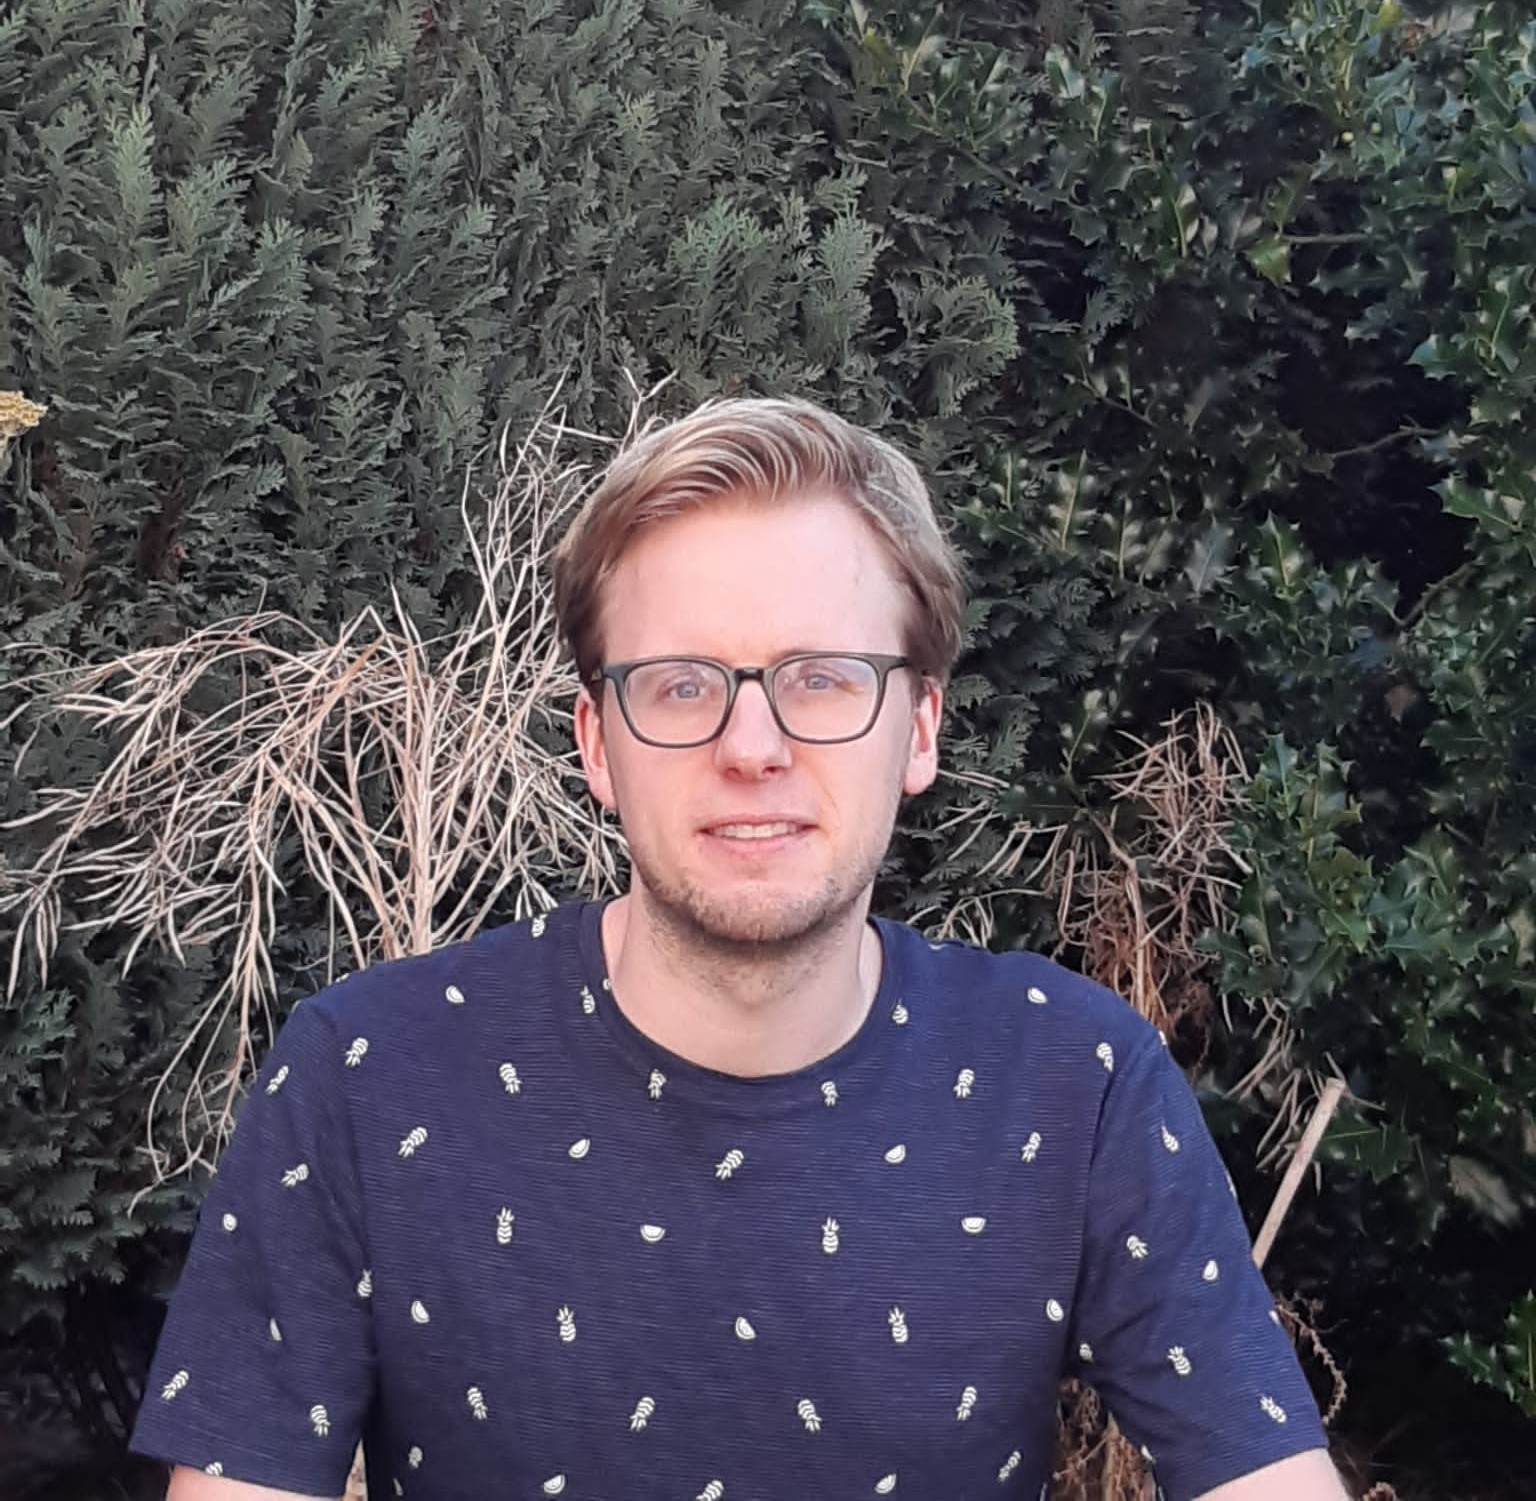
Speaker: Jakob Raymaekers, Maastricht University, The Netherlands
Date: 29th September 2022, at 12:30-13:30 CEST
Classification is a major tool of statistics and machine learning. A classifi- cation method first processes a training set of objects with given classes (labels), with the goal of afterward assigning new objects to one of these classes. When running the resulting prediction method on the training data or on test data, it can happen that an object is predicted to lie in a class that differs from its given label. This is sometimes called label bias, and raises the question whether the object was mislabeled. The proposed class map reflects how well an object lies within its class, by comparing to an alternative class as done in Rousseeuw (1987) for unsupervised classification. The class map also shows how far the object is from the other objects in its class, and whether some objects lie far from all classes. The goal is to visualize aspects of the classification results to obtain insight in the data. The display is constructed for discriminant analysis, the k-nearest neighbor classifier, support vector machines, logistic regression, and coupling pairwise classifications. It is illustrated on several benchmark datasets, including some consisting of images and texts.
Bio:
Jakob Raymaekers is assistant professor at the Quantitative Economics department of the School of Business and Economics of Maastricht University. His research focuses on robust and computational statistics, clustering and machine learning. In particular, he has developed methodology and software for robust covariance and correlation estimators, visualizing classification results and clustering high-dimensional data sets. Currently, he is engaged in collaborations with BASF and Roche Diagnostics. Jakob previously worked at the UBC (Canada), KU Leuven (Belgium) and UAntwerp (Belgium).
