- Indico style
- Indico style - inline minutes
- Indico style - numbered
- Indico style - numbered + minutes
- Indico Weeks View
Your profile timezone:

Chair: Jean-Michel Poggi
Date: 12th July 2024, at 14:30-15:30 CEST
This webinar will provide an in-depth tutorial on the 'funcharts' R package [1,2], developed in the context of the research activities of the “Statistics For Engineering Research” (SFERe; www.sfere.unina.it) group of the Department of Industrial Engineering of the University of Naples Federico II (Italy). Emphasis will be given to its features that align with the latest with the latest developments in statistical process monitoring (SPM) for multivariate functional quality characteristics. Participants will gain a comprehensive understanding of how the 'funcharts' R package can be employed in contemporary SPM scenarios, thereby broadening their analytical skills and statistical toolkit. In the domain of SPM, enhancing profile monitoring, which involves the analysis and surveillance of quality characteristics represented as functional data, has become increasingly vital. The 'funcharts' R package stands out as an essential tool in this developing area, filling a notable void in software solutions for the practical implementation of profile monitoring, particularly for multivariate functional data. The 'funcharts' R package allows for the adjustment of functional quality characteristics for covariate effects and enables real-time analysis of profiles observed up to a certain domain point. The session will primarily focus on the hands-on application of 'funcharts' within the R environment, showcased through its built-in data generator. Moreover, this webinar will introduce a recently implemented method within the 'funcharts' package that focuses on robust multivariate functional control charts [3]. This new method represents a significant advancement in the field by offering advanced tools for addressing outliers in multivariate functional data.
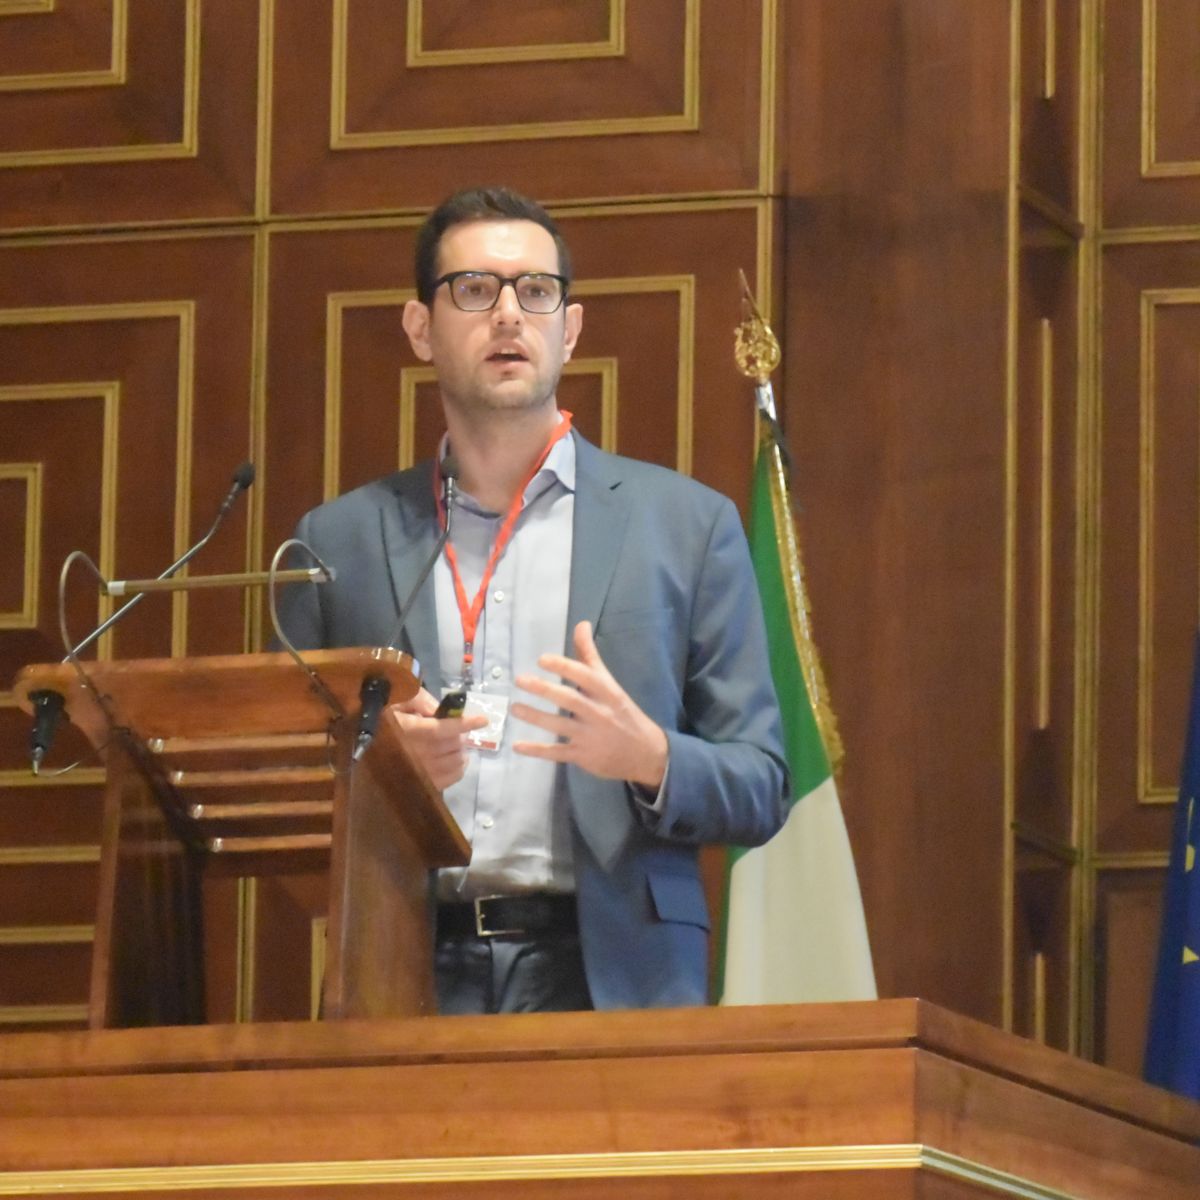
Christian Capezza is Assistant Professor of Statistics at the Department of Industrial Engineering of the University of Naples Federico II. He holds an MSc degree in Engineering Management and a PhD in Industrial Engineering, both obtained from the same university. During his PhD, he was a visiting scholar at the Department of Statistical Sciences of the University of Padova and at the School of Mathematics of the University of Bristol. His main research interests include generalized additive models and functional data analysis, particularly in the context of statistical process monitoring (SPM). He is the maintainer of the 'funcharts' R package, a project that aims to bridge theoretical research with practical applications in SPM with multivariate functional data. He is a member of the Statistics for Engineering Research (SFERe) group at the University of Naples Federico II (https://www.sfere.unina.it/).

References:
[1] Capezza, C., Centofanti, F., Lepore, A., Menafoglio, A., Palumbo, B., Vantini, S. (2024). funcharts: Functional Control Charts. R package version 1.4.1. Available at: https://CRAN.R-project.org/package=funcharts.
[2] Capezza, C., Centofanti, F., Lepore, A., Menafoglio, A., Palumbo, B., Vantini, S. (2023). funcharts: Control charts for multivariate functional data in R. Journal of Quality Technology, 55(5), 566-583. https://doi.org/10.1080/00224065.2023.2219012.
[3] Capezza, C., Centofanti, F., Lepore, A., Palumbo, B. (2024). Robust Multivariate Functional Control Chart. Technometrics. https://doi.org/10.1080/00401706.2024.2327346.